Configurable Dashboard
product
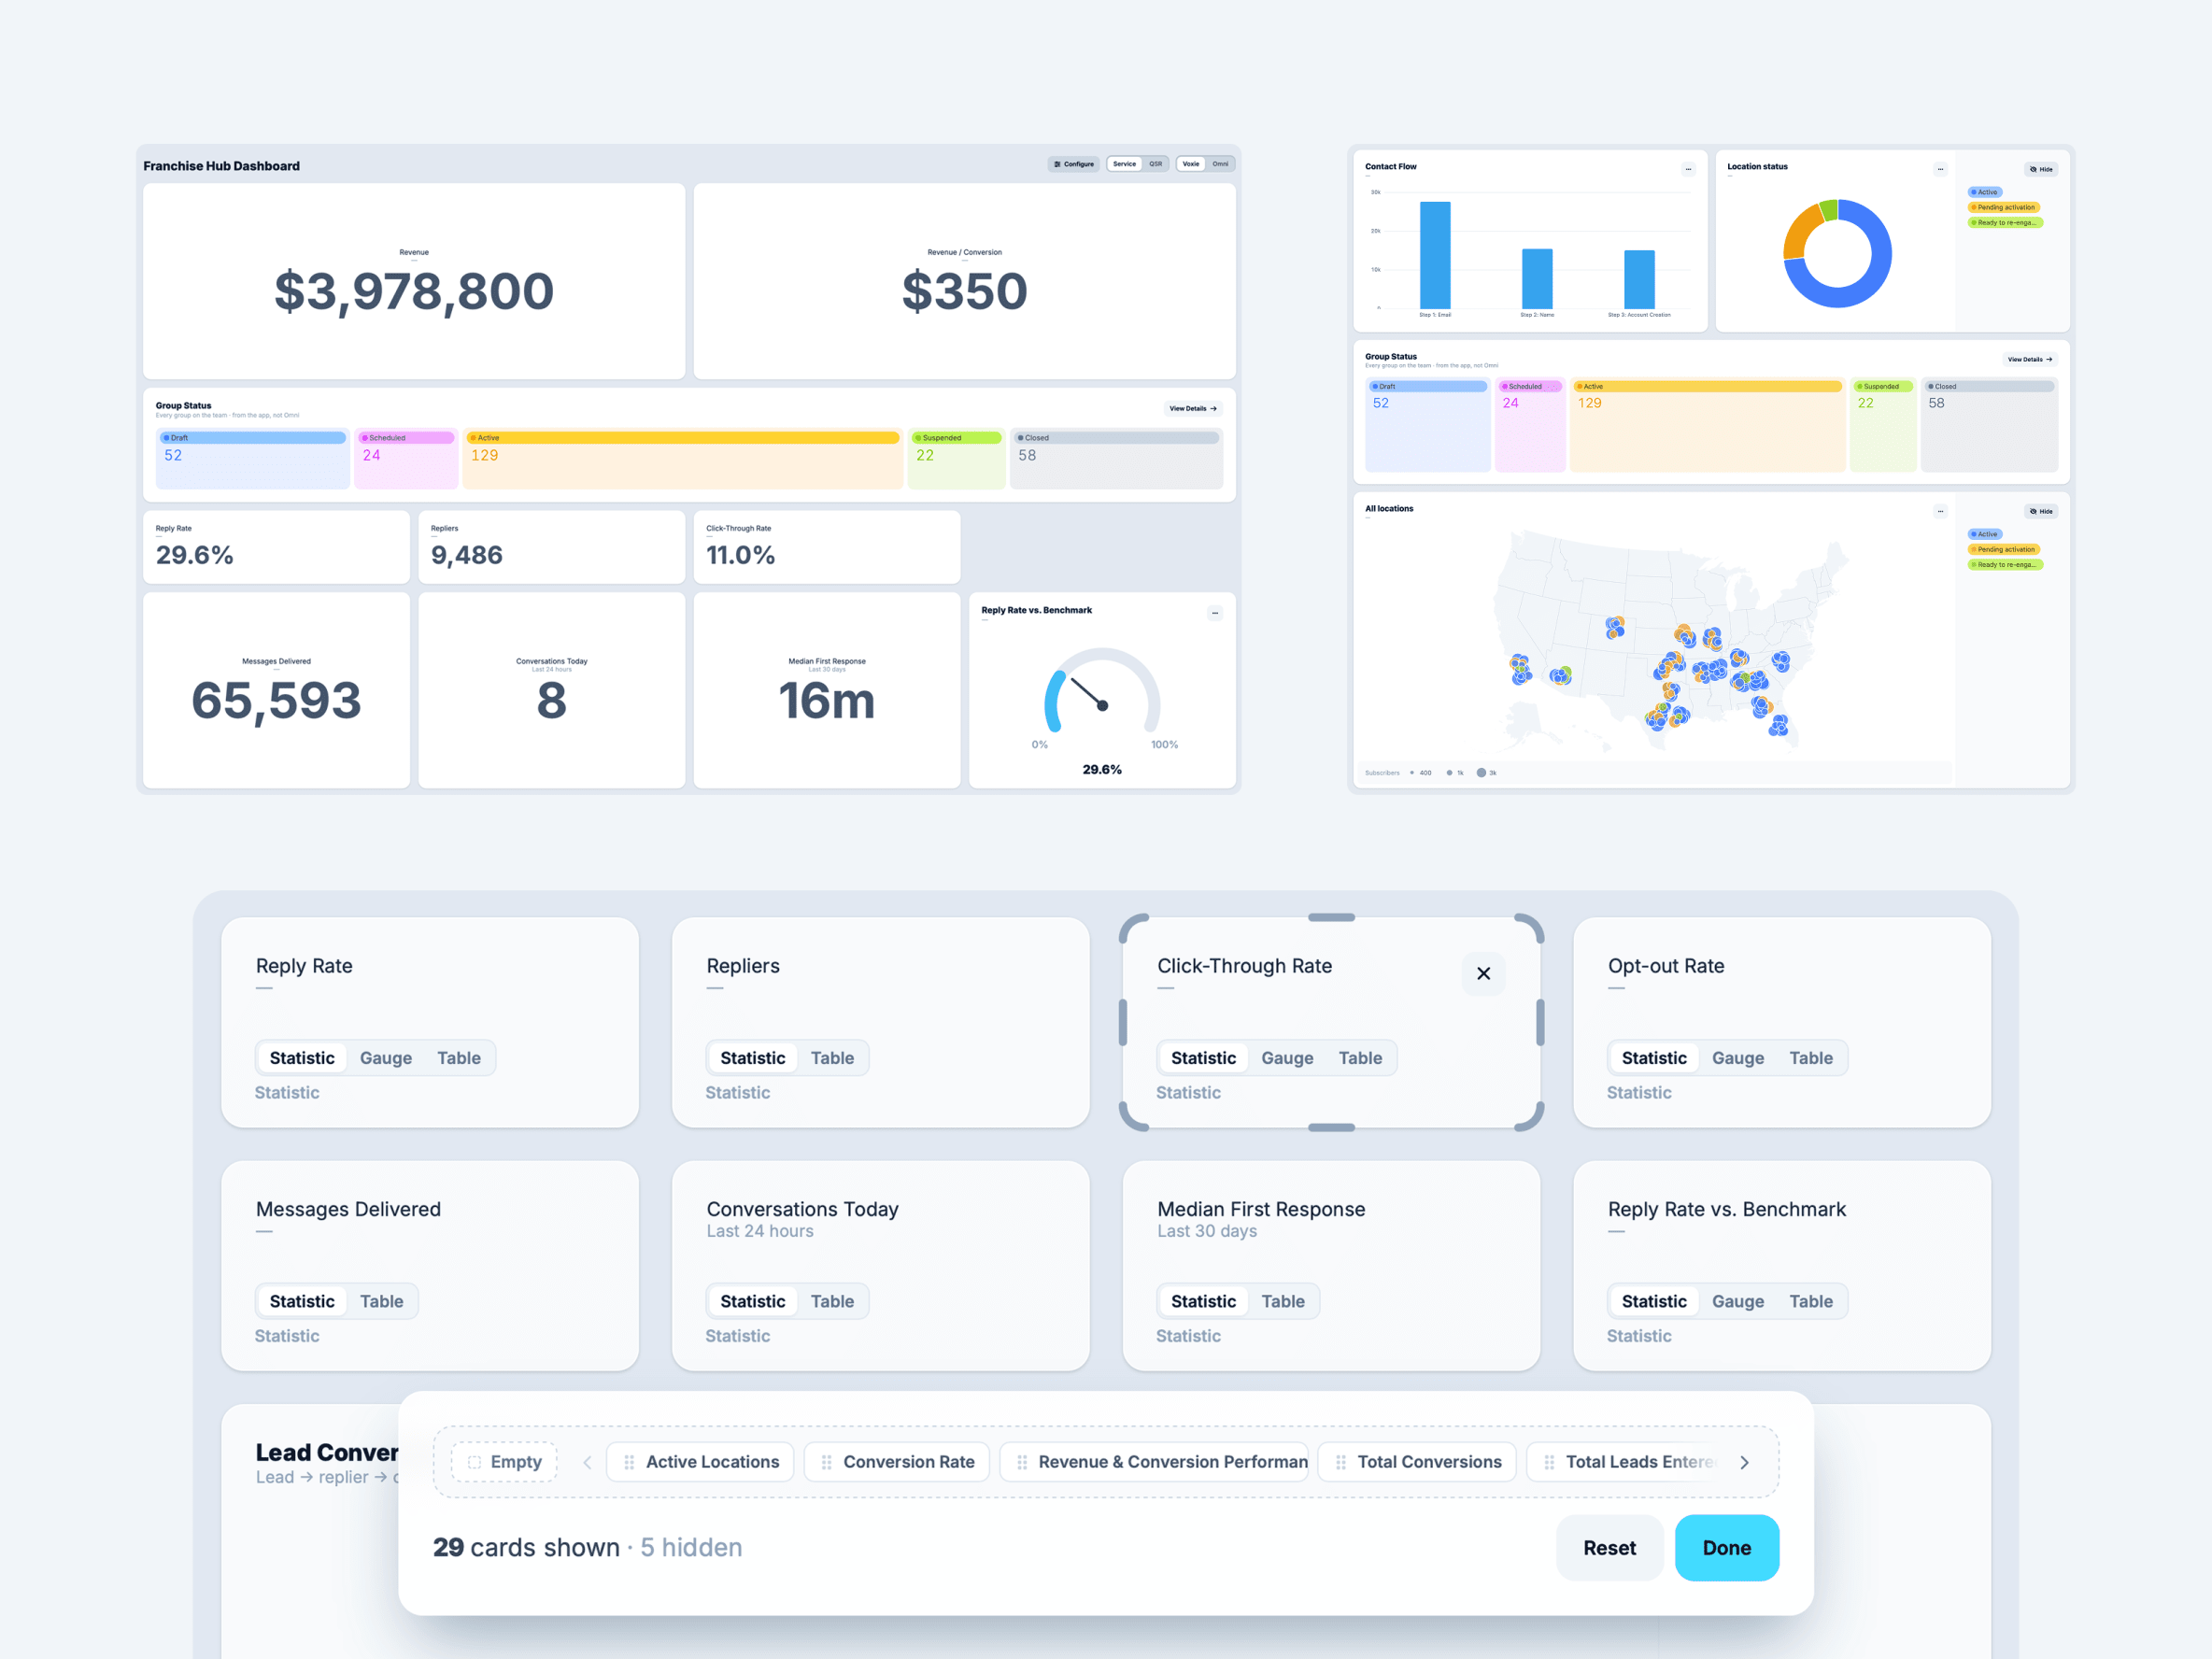
This round of work focused on expanding to the full set of mock data for Service vertical.
The details were refined to better match Voxie production.
Configuration user experience was also refined to allow managing the grid of items to be better configured per user.
Chart types were expanded to support bar charts, U.S. based maps, and an expanded distribution chart.
All charts were expanded to work on all grid cell sizes that you can use on the Dashboard demo.